Determining whether algal cells are alive or dead is useful for a variety of applications including, but not limited to: wastewater analysis, algaecide testing, mesocosm experiments, and ballast water monitoring. Viability staining is a common approach used in flow cytometry to evaluate the relative abundance of live and dead cells in a sample. The FlowCam 8400, equipped with a laser, digital camera, and 2 channels of fluorescence detection, can be paired with various fluorescent stains to assess the viability of algal cells. Here we will describe how to pair an example of one such stain, fluorescein diacetate (FDA), with the FlowCam 8400 equipped with a 488nm blue laser.
FDA itself is not a fluorescent molecule. However, when a live cell with active hydrolysis enzymes encounters FDA in an aqueous sample, the cell converts FDA to fluorescein isothiocyanate (FITC) - a molecule that fluoresces green. If a cell is alive and its membrane is intact, it will emit a green fluorescence signal when it is triggered by the FlowCam’s laser. Dead cells may also still emit green fluorescence, but they will do so at lower levels than live cells.
Sample Preparation
We are presenting data from two experiments: one using a culture of the green algae Staurastrum, and the other from a natural sample collected from a small eutrophic pond.
1. To prepare the FDA primary stock solution, mix DMSO to form a 5 mg/mL solution. Next, prepare a working stock by mixing 25μL of the primary stock with 10mL of DI water and store at 4°C.
2. Filter the culture and pond sample through a 70μm strainer to make sure no large particles clog the flow cell.
3. Stain two 10mL aliquots of the Straurastrum culture and the pond sample. One aliquot of each sample will be used to test for live cells, and the other to test for dead cells. To kill the cells in each of the two “dead test” aliquots, incubate the samples in a 70-90°C water bath for 30 minutes.
4. Once the algal samples are prepared, add a 250μL aliquot of the FDA working solution to 1mL of each sample and incubate in the dark at room temperature for 10 minutes.
FlowCam Procedure
After incubation, run each sample on a FlowCam 8400 with a 488nm laser in Trigger mode using the 10X objective, 100μm FOV flow cell, and 1.0mL syringe. When operating the FlowCam in Trigger mode, cells containing sufficient levels of chlorophyll or FDA will “trigger” the camera to capture an image. Since the FlowCam 8400 contains two separate emission detectors, it can simultaneously record the cells’ relative fluorescence for both chlorophyll (designated in VisualSpreadsheet as Channel 1), and the green emission of live cells stained with FDA (Channel 2). Channel 1 detects emissions greater than 650nm and Channel 2 detects emissions from 510nm to 540nm.
Analysis
|
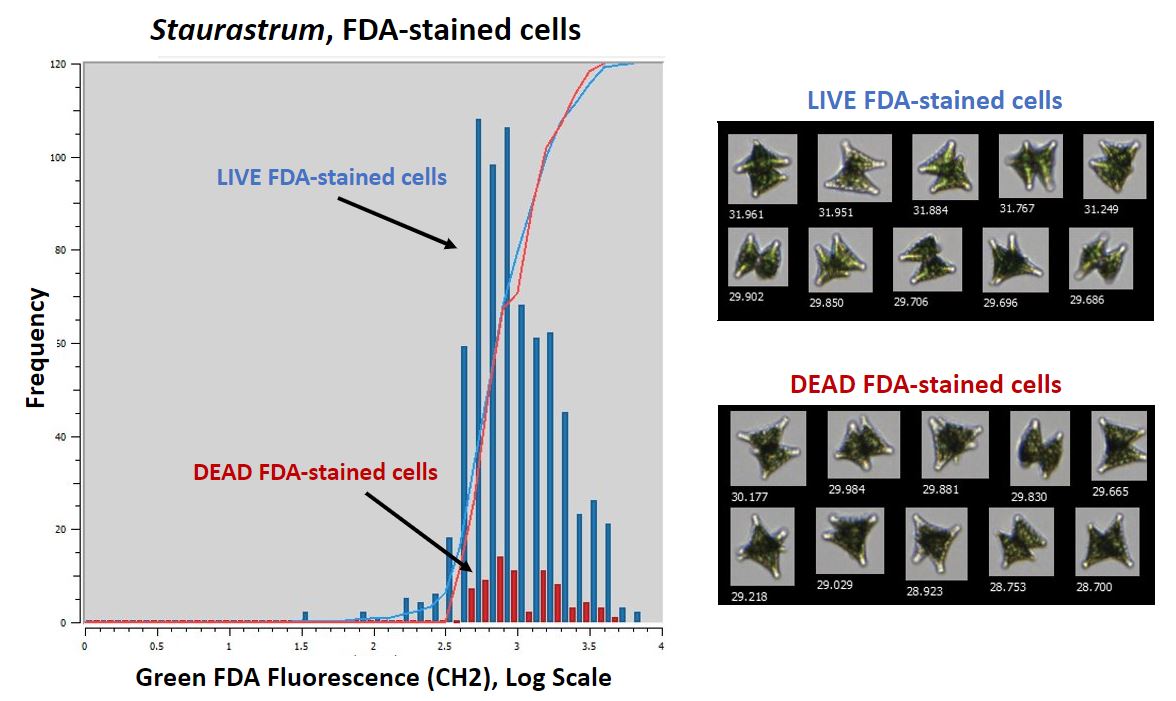
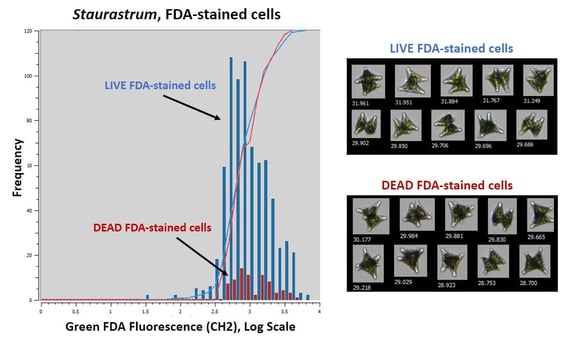
Figure 1. Comparison of live vs. dead Staurastrum cells stained with FDA |
Figure 1 shows the results of the live vs. dead Staurastrum experiment. The graph shows the frequency of Staurastrum cells that emitted enough green fluorescence to be detected by Channel 2 (CH2). The blue bars in the Figure 1 graph represent cells from the live culture, and the red bars indicate cells from the dead culture. The higher frequency of fluorescence emission in the live cells indicates that those cells absorbed the FDA stain. The opposite is true for dead cells, which did not absorb FDA as frequently. Figure 1 also includes example images from the live and dead samples. The similarity of the two collages illustrates that you cannot assess cell viability by looking at the images alone. Fluorescence is therefore required to differentiate between live and dead cells.
|
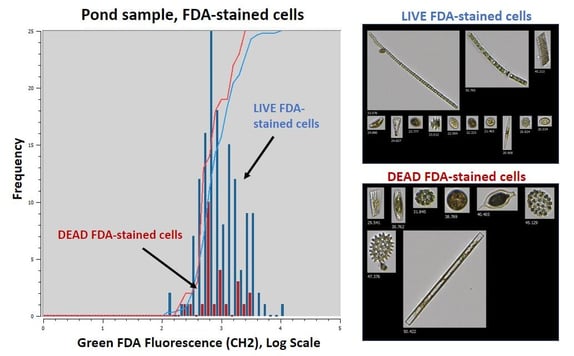
Figure 2. Comparison of live vs. dead pond samples stained with FDA |
Figure 2 shows similar results for the natural sample obtained from the pond. As we saw with the cultured Staurastrum sample, live cells stained with FDA exhibit higher overall Channel 2 (green fluorescence) detection compared to the dead cells stained with FDA.
In some applications, FDA produces a precipitate that also fluoresces. This occurred with the pond sample (Figure 3). Including the counts of precipitate data would skew results when counting live cells. Fortunately, with the FlowCam, the user can use the image recognition capabilities of the FlowCam’s VisualSpreadsheet® software to identify precipitate images and remove them from the counts of the live cells.

|
| Figure 3. Example images of FDA precipitate found in the pond sample that also fluoresce green. These particles can be auto-selected using VisualSpreadsheet’s image recognition algorithm to produce accurate concentrations of live cells. |
Summary
We've shown here how FDA can be used to assess live versus dead cells in mixed populations. Both cultures and natural samples were used to demonstrate the use of the FDA stain when analyzed by a FlowCam 8400 equipped with a 488nm laser. There are several other fluorescing stains and simple colormetric stains that can be used to assess both live and dead cells when using a FlowCam, including:
- ThermoFisher LIVE DEAD® Fixable Green Dead Cell Stain Kit (488nm Excitation)
- ThermoFisher LIVE DEAD® Fixable Red Dead Cell Stain Kit (633nm Excitation)
- Sytox Green DEAD CELL Stain (488nm Excitation)
- Neutral Red - Colormetric Vital Stain
- Methylene Blue - Colormetric Dead Stain (for Yeast viability analysis)


